Angular Charts Series Articles
- Best Angular Chart Libraries
- How to use ngx-charts in angular application ?
- Data Vizualization with ECharts in Angular Using NGX-ECHARTS
- Awesome Charts in Angular 13 with ng2-charts
Charts helps us to visualize large amount of data in an easy to understand and interactive way.
This helps businesses to grow more by taking important decisions from the data.
For example, e-commerce can have charts or reports for product sales, with various categories like product type, year, etc.
In angular, we have various charting libraries to create charts. Ngx-charts is one of them.
Check out the list of best angular chart libraries.
In this article, we will see data visualization with ngx-charts and how to use ngx-charts in angular application ?
We will see,
- How to install ngx-charts in angular ?
- Create a vertical bar chart
- Create a pie chart, advanced pie chart and pie chart grid
ngx-charts is an open-source and declarative charting framework for angular2+. It is maintained by Swimlane.
It is using Angular to render and animate the SVG elements with all of its binding and speed goodness and uses d3 for the excellent math functions, scales, axis and shape generators, etc.
By having Angular do all of the renderings it opens us up to endless possibilities the Angular platform provides such as AoT, Universal, etc.
ngx-charts supports various chart types like bar charts, line charts, area charts, pie charts, bubble charts, doughnut charts, guage charts, heatmap, treemap and number cards.
It also supports features like autoscaling, timeline filtering, line interpolation, configurable axis, legends, real-time data support and so on.
- Create a new angular application using the following command
(Note: skip this step if you want to add ngx-charts in the existing angular application, At the time of writing this article I was using angular 9).ng new ngx-charts-demo
- Install ngx-charts package in an angular application using the following command.
npm install @swimlane/ngx-charts --save
- At the time of installation if you get the following error
ERROR in The target entry-point "@swimlane/ngx-charts" has missing dependencies:
 - @angular/cdk/portal
we need to add
@angular/cdkusing the followingnpm install @angular/cdk --save
- Import
NgxChartsModulefrom'ngx-charts'in AppModule. - ngx-charts also required the
BrowserAnimationsModule. Import it inAppModule.
So our final AppModule will look like :
import { BrowserModule } from '@angular/platform-browser';
import { NgModule } from '@angular/core';
import { AppComponent } from './app.component';
import { NgxChartsModule }from '@swimlane/ngx-charts';
import { BrowserAnimationsModule } from '@angular/platform-browser/animations';

@NgModule({
  declarations: [
    AppComponent
  ],
  imports: [
    BrowserModule,
    BrowserAnimationsModule,
    NgxChartsModule
  ],
  providers: [],
  bootstrap: [AppComponent]
})
export class AppModule { }
Great, Installation steps are done. Now let’s develop various charts using ngx-charts components.
In AppComponent we will create the following sales data array. We will use this object to generate charts.
import { Component } from '@angular/core';

@Component({
  selector: 'app-root',
  templateUrl: './app.component.html',
  styleUrls: ['./app.component.css']
})
export class AppComponent {
  saleData = [
    { name: "Mobiles", value: 105000 },
    { name: "Laptop", value: 55000 },
    { name: "AC", value: 15000 },
    { name: "Headset", value: 150000 },
    { name: "Fridge", value: 20000 }
  ];
}
ngx-charts provides various components to generate vertical bar chart, pie chart, advanced pie chart, pie chart grid and so on.
To generate a vertical bar chart, ngx-charts provide ngx-charts-bar-vertical component, add it on the template as below:
<ngx-charts-bar-vertical
    [view]="[1000,400]"
    [results]="saleData"
    [xAxisLabel]="'Products'"
    [legendTitle]="'Product Sale Chart'"
    [yAxisLabel]="'Sale'"
    [legend]="true"
    [showXAxisLabel]="true"
    [showYAxisLabel]="true"
    [xAxis]="true"
    [yAxis]="true"
    [gradient]="true">
</ngx-charts-bar-vertical>
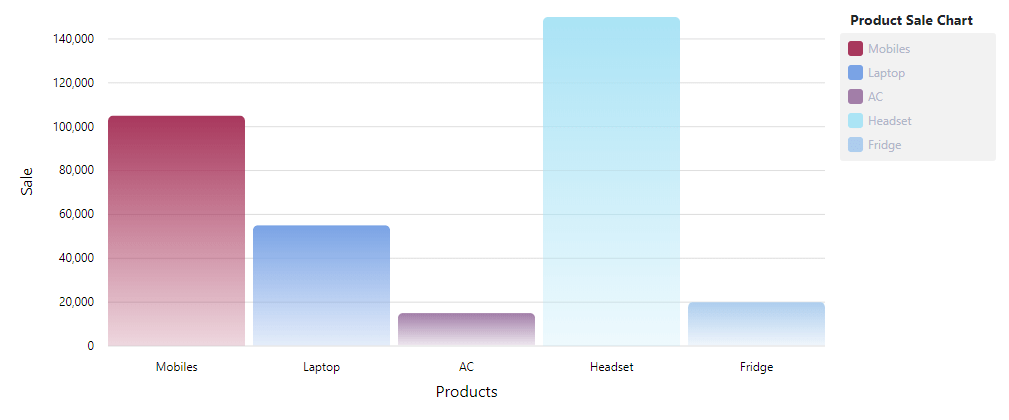
👉 Important properties of ngx-charts-bar-vertical component
- results: To render salesData chart we need to assign this data object to results
- view: set width and height of chart view
- xAxisLabel
- legendTitle
- legend : if you want to show legend set it to true, default it is false.
- showXAxisLabel : set true to show x-axis label.
- showYAxisLabel: set true to show y-axis label.
- xAxis / xAxis : set true to show specific axis.
- gradient: set it to true to show bar with gradient background.
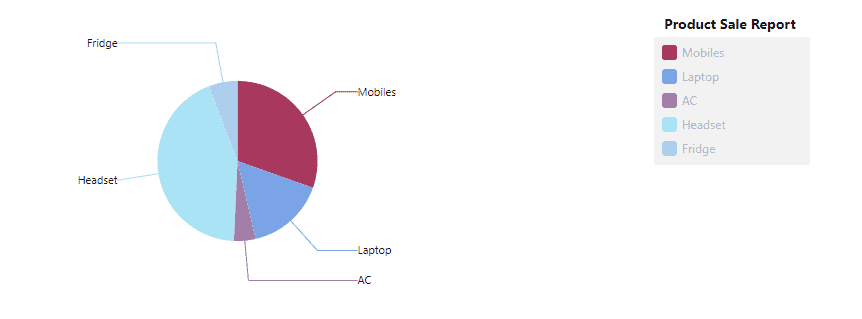
We can generate pie chart using < ngx-charts-pie-chart > component. add it in template as below.
<ngx-charts-pie-chart
    [results]="saleData"
    [legend]="true"
    [legendTitle]="'Product Sale Report'"
    [view]="[1000,300]"
    [labels]="true" >
</ngx-charts-pie-chart>
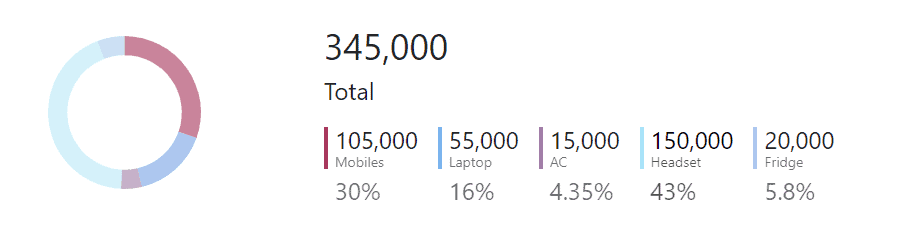
We can generate advanced pie chart using < ngx-charts-advanced-pie-chart > component as below.
<ngx-charts-advanced-pie-chart
      [results]="saleData"
      [gradient]="true" >
</ngx-charts-advanced-pie-chart>
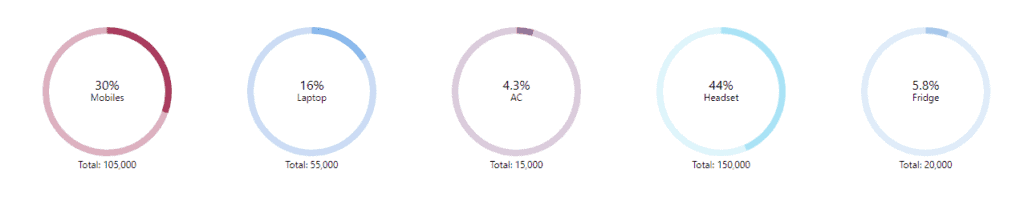
To generate pie chart grid we need to < ngx-charts-pie-grid > component on template as below.
<ngx-charts-pie-grid
  [results]="saleData" >
</ngx-charts-pie-grid>
Great !!! we are done with ngx-charts implementation✨✨✨.
import { BrowserModule } from '@angular/platform-browser';
import { NgModule } from '@angular/core';
import { AppComponent } from './app.component';
import { NgxChartsModule }from '@swimlane/ngx-charts';
import { BrowserAnimationsModule } from '@angular/platform-browser/animations';

@NgModule({
  declarations: [
    AppComponent
  ],
  imports: [
    BrowserModule,
    BrowserAnimationsModule,
    NgxChartsModule
  ],
  providers: [],
  bootstrap: [AppComponent]
})
export class AppModule { }
import { Component } from '@angular/core';

@Component({
  selector: 'app-root',
  templateUrl: './app.component.html',
  styleUrls: ['./app.component.css']
})
export class AppComponent {
  saleData = [
    { name: "Mobiles", value: 105000 },
    { name: "Laptop", value: 55000 },
    { name: "AC", value: 15000 },
    { name: "Headset", value: 150000 },
    { name: "Fridge", value: 20000 }
  ];
}
<nav class="navbar navbar-expand navbar-light bg-primary">
  <div class="nav navbar-nav">
    <h5 class="nav-item nav-link active text-white">NGX-CHARTS DASHBOARD </h5>
  </div>
</nav>
<div class="container-fluid">
  <div class="row pt-2">
    <div class="col-md-12">
      <div class="card text-left">
        <div class="card-body">
          <h4 class="card-title border-bottom">Vertical Bar Charts</h4>
          <ngx-charts-bar-vertical
              [view]="[1000,400]"
              [results]="saleData"
              [xAxisLabel]="'Products'"
              [legendTitle]="'Product Sale Chart'"
              [yAxisLabel]="'Sale'"
              [legend]="true"
              [showXAxisLabel]="true"
              [showYAxisLabel]="true"
              [xAxis]="true"
              [yAxis]="true"
              [gradient]="true">
          </ngx-charts-bar-vertical>
        </div>
      </div>
    </div>
    <div class="col-md-12">
      <div class="card text-left">
        <div class="card-body">
          <h4 class="card-title border-bottom">Advanced Pie Charts</h4>
          <ngx-charts-advanced-pie-chart
                [results]="saleData"
                [gradient]="true" >
          </ngx-charts-advanced-pie-chart>
        </div>
      </div>
    </div>
    <div class="col-md-12">
      <div class="card text-left">
        <div class="card-body">
          <h4 class="card-title border-bottom">Pie Grid Charts</h4>
          <ngx-charts-pie-grid
            [results]="saleData" >
          </ngx-charts-pie-grid>
        </div>
      </div>
    </div>
    <div class="col-md-12">
      <div class="card text-left">
        <div class="card-body">
          <h4 class="card-title border-bottom">Pie Charts</h4>
          <ngx-charts-pie-chart
              [results]="saleData"
              [legend]="true"
              [legendTitle]="'Product Sale Report'"
              [view]="[1000,300]"
              [labels]="true" >
          </ngx-charts-pie-chart>
        </div>
      </div>
    </div>
  </div>
</div> 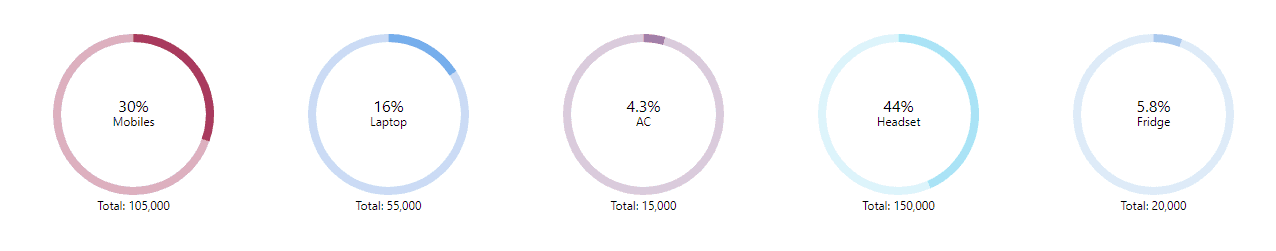
In this article, We have seen data visualization with ngx-charts in angular application. We have installed the ngx-charts library and created various charts using sample data.
I hope you like this article, please provide your valuable feedback and suggestions in below comment section🙂.
For more updates, Follow us 👍 on NgDevelop Facebook page.