Best Angular Chart Libraries

Nowadays, Data analysis is a crucial part of any business application. This helps businesses to make important decisions. It is important to represent a large amount of data in an easy to understand and interactive way.

Charts are very useful for beautiful, easy to understand and interactive data representation and visualization. 

There are different open-source and paid chart libraries available in javascript (with angular wrapper) for beautiful data representation.

In this article, we will see the best angular chart libraries for beautiful and interactive data representation.

First, we will see open-source angular chart libraries, late on we will look into other paid chart libraries for angular

These are the best open-source angular chart libraries available with angular wrapper.

NPM Downloads : Last one year angular chart libraries trend
ngx-charts : Grouped Vertical Bar Chart
GitHub stars GitHub forks NPM NPM Downloads

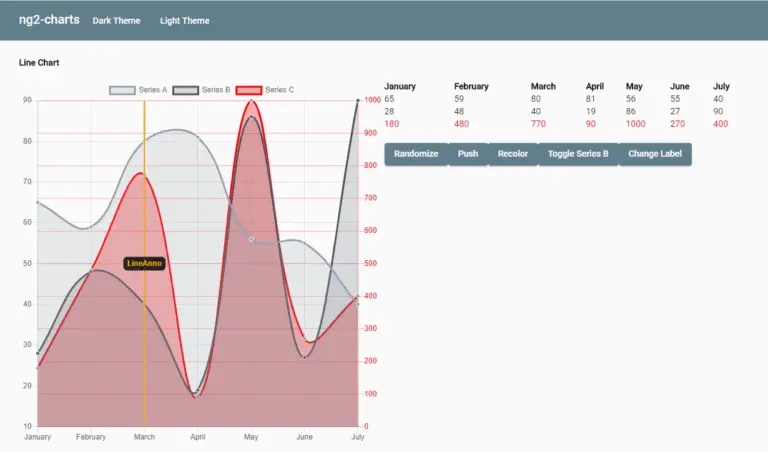
ngx-charts is a declarative charting framework for angular2+.

It is using Angular to render and animate the SVG elements with all of its binding and speed goodness and uses d3 for the excellent math functions, scales, axis and shape generators, etc.

By having Angular do all of the renderings it opens us up to endless possibilities the Angular platform provides such as AoT, Universal, etc.

ngx-charts allows us to customize the styles using CSS. We can also create custom charts using ngx-charts components.

It has an active developer community.

Check out this article, How to use ngx-charts in angular application ?

Ngx-charts Features

  • Horizontal & Vertical Bar Charts (Standard, Grouped, Stacked, Normalized)
  • Line
  • Area (Standard, Stacked, Normalized)
  • Pie (Explodable, Grid, Custom legends)
  • Bubble
  • Doughnut
  • Gauge (Linear & Radial)
  • Heatmap
  • Treemap
  • Number Cards
  • Autoscaling
  • Timeline Filtering
  • Line Interpolation
  • Configurable Axis Labels
  • Legends (Labels & Gradient)
  • Advanced Label Positioning
  • Real-time data support
  • Advanced Tooltips
  • Data point Event Handlers
  • Theming
  • Works with ngUpgrade
ngx-echarts : chart types
GitHub stars GitHub forks NPM NPM Downloads

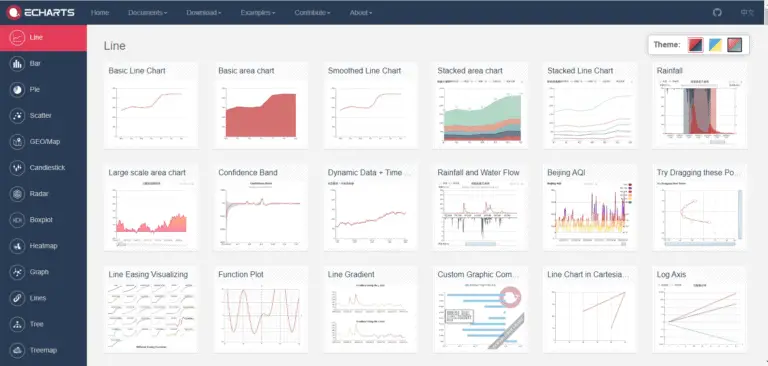
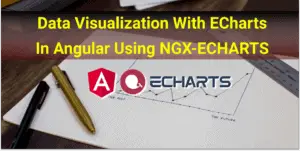
ngx-echarts is an Angular (ver >= 2.x) directive for ECharts (ver >= 3.x)

ECharts is an open-sourced, web-based, cross-platform framework that supports the rapid construction of interactive visualization. 

It has 39.6k stars and 13.2k forks on github, ECharts is regarded as a leading visualization development tool in the world, and ranks the third in the GitHub visualization tab.

Source

It can run fluently on PC and mobile devices. It is compatible with most modern Web Browsers, e.g., IE8/9/10/11, Chrome, Firefox, Safari and so on. ECharts depends on ZRender, a graphic rendering engine, to create intuitive, interactive, and highly-customizable charts.

Ngx-echarts Features

Line series, bar series, scatter series, pie charts, candle-stick series, boxplot series for statistics, map series, heatmap series, line series for directional information, graph series for relationships, treemap series, sunburst series, parallel series for multi-dimensional data, funnel series, gauge series

Besides the built-in chart types, ECharts also provide the custom series for users to create a specific chart type.

  • Loading Handling
  • Event Handling
  • Real-time data update
  • Initial Options
  • Auto Resize
  • Theming
  • Connect Charts
  • Draggable Charts
  • 3D Charts

Refer ECharts Documentation for more customization.

👉 Checkout here Data Visualization with ECharts in Angular using NGX-ECHARTS (with COVID Tracker Sample Application).

ng2-charts : line chart
GitHub stars GitHub forks NPM NPM Downloads

ng2-charts is an Angular2 directive for Chart.js

Chart.js is a popular opensource javascript charting library

Chart.js uses HTML5 canvas which provides great rendering performance across all modern browsers(IE11+).

It provides schematics for easy integration in angular application.

ng2-charts Features

ng2-charts supports 8 chart types: line chart, bar chart, radar chart, pie chart, polar-area chart, doughnut chart, bubble chart and scatter chart.

angular-plotly.js : chart types
GitHub stars GitHub forks NPM NPM Downloads

Angular-plotly.js is a plotly.js angular component from plotly.

It supports Angular 9.x, If you want to use with Angular 8.x, please use version [email protected]

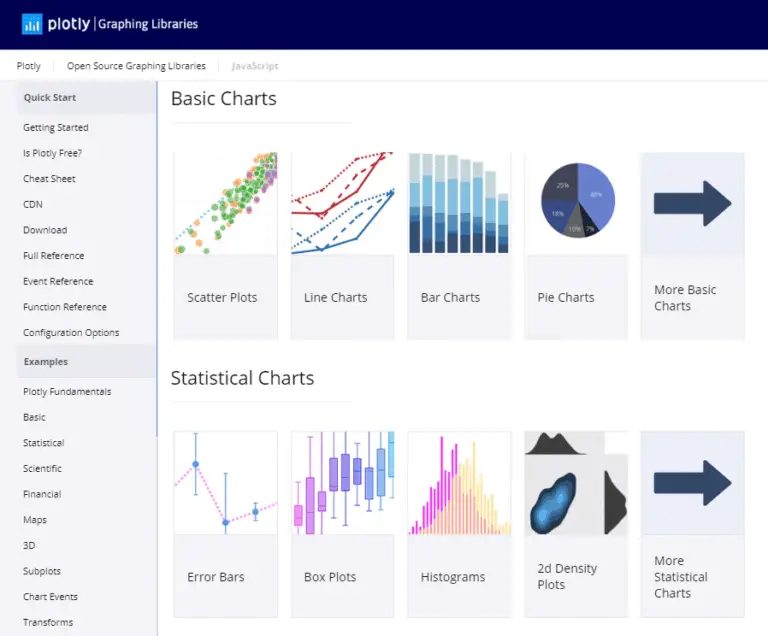
Built on top of d3.js and stack.gl, plotly.js is a high-level, declarative charting library. plotly.js ships with over 40 chart types, including scientific charts, 3D graphs, statistical charts, SVG maps, financial charts, and more.

Plotly.js has 11.2k stars and 1.3k forks on github.

Source

angular-plotly.js Features

Basic Charts:  Scatter Plots, Bar Charts, Line Charts, Pie Charts, Bubble Charts, Dot Plots, Filled Area Plot, Horizontal bar charts, Sunburst Charts, Sankey Diagram, Point Cloud, Multi Chart Types

Statistical Charts: Error Bars, Box Plots, Histograms, 2D density plots, parallel categories diagram.

Financial Charts: Waterfall Charts, Indicators, CandleStick charts, Funnel and Funnel Area Charts.

Maps: Mapbox map layers, Mapbox density heatmap, Choropleth mapbox, lines on maps etc.

3D Charts: 3D Scatter Plots, Ribbon Plots, 3D Surface plots, 3D mesh plots etc

  • Download as SVG / PNG
  • Data export
  • Events Handling
  • Auto Resize
  • Scroll
  • Zoom
  • Filter
  • Animation
  • Group by
Refer Plotly.js documentation for more customization details
PrimeNG Charts : Bar Chart
GitHub stars GitHub forks NPM NPM Downloads

Note: These states are for the PrimeNG complete UI collection package.

PrimeNg chart components are based on Charts.js 2.7.x, an open-source HTML5 based charting library.

PrimeNG is a collection of rich UI components for Angular. All widgets are open source and free to use under MIT License.

PrimeNG Chart Features

Currently, there are 6 options available; pie chart, doughnut chart, line(line or horizontal bar) chart, bar chart, radar chart, and polar area chart.

Google Charts : Pie Chart
GitHub stars GitHub forks NPM Downloads

angular-google-charts is a wrapper of the Google Charts library written for Angular 6 & 7.

Google chart tools are powerful, simple to use, and free.

Note: Google Charts is free, but not open-source. Google’s licensing does not allow you to host their JS files on your server. So if you are an enterprise and have some sensitive data, Google Charts might not be the best option.

HighCharts Angular : Line Chart
GitHub stars GitHub forks NPM Downloads

Highcharts Angular is an official Highcharts wrapper for angular.

Highcharts is a modern SVG-based, multi-platform charting library. It has a rich set of chart collection.

Highcharts is free for non-commercial use and paid for commercial use.

Fusion Charts : Bar Chart
GitHub stars GitHub forks NPM Downloads

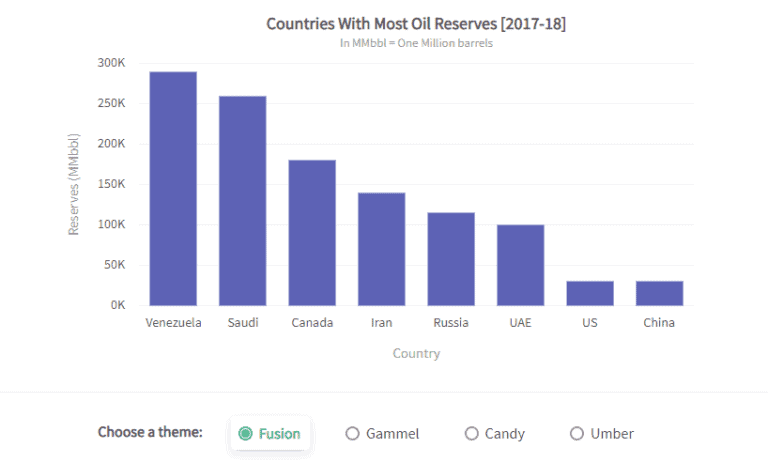
angular-fusioncharts is a simple and lightweight official Angular component for FusionCharts JavaScript charting library. angular-fusioncharts enables you to add JavaScript charts in your Angular application without any hassle.

FusionCharts is a javascript chart library and has charts like pie, column, area, line, radar, and over 150 other charts for web application.

Fusion charts provides paid licance for commercial use.

In this article, we have seen five best open-source angular chart libraries and other paid angular chart libraries.

I have given an angular chart library ranking based on my research. I hope you like this article, please provide your valuable feedback and suggestions in below comment section🙂.

For more updates, Follow us 👍 on NgDevelop Facebook page.