
Charts help us to visualize large amounts of data in an easy-to-understand and interactive way.
In angular, we have various charting libraries to create charts. In the previous article, we have seen Data visualization with ECharts in angular using ngx-echarts.
Angular Charts Series Articles
- Best Angular Chart Libraries
- How To Use Ngx-Charts In Angular Application ?
- Data Visualization With ECharts In Angular Using Ngx-Echarts
- Awesome Charts In Angular 13 With Ng2-Charts
In this article, we will develop awesome charts in angular 13 with ng2-charts.
We will see,
- Introduction about the ng2-charts
- Different ways to install ng2-charts in angular.
- Create a bar chart
- Create a line chart
ng2-charts is an open-source chart library based on chart.js.
Chart.js is a popular javascript charting library. ng2-charts is a wrapper around chart.js. It provides baseChart directive to render the chart.
ng2-charts has ~2K GitHub Stars and around 767k monthly downloads on npm.


It supports the following chart types :
- Line Chart
- Pie Chart
- Bar Chart
- Doughnut Chart
- Radar Chart
- Polar Area Chart
- Bubble Chart
- Scatter Chart
Also provides many customization options like :
- Responsiveness
- Animation customization
- Chart Title
- Legends
- Labels
- Colors
- Tooltip
- Theming
- Combine Charts
- Options (as from chart.js documentation)
ng2-charts now also provides add and generate schematics for installation and generating above supported charts.
Create a new angular application using the following command
(Note: skip this step if you want to add ng2-charts in the existing angular application, At the time of writing this article I was using angular 13).
ng new angular-ng2-charts-demo
We have two ways to install ng2-charts in angular application.
- Using
ng addschematic - Manual installation
Installing ng2-charts using ng add schematic
This is an easy way to install ng2-charts in angular. Execute the following ng add schematic command
ng add ng2-charts
This command,
- automatically installs the
ng2-chartsandchart.jslibraries and - Imports and add
NgChartsModuleinapp.module.tsto start using the library right away.
If you get the error :
Cannot find module '@angular/cdk/schematics'
Install @angular/cdk with following command
npm install --save @angular/cdk
Manually install ng2-charts
- Install the
ng2-chartsandchart.jspackage using following commands
npm install ng2-charts --save
npm install chart.js --save
2. Import the NgChartsModule in your app main module.
So our final AppModule will look like:
import { NgModule } from '@angular/core';
import { BrowserModule } from '@angular/platform-browser';

import { AppComponent } from './app.component';
import { NgChartsModule } from 'ng2-charts';

@NgModule({
  declarations: [
    AppComponent
  ],
  imports: [
    BrowserModule,
    NgChartsModule
  ],
  providers: [],
  bootstrap: [AppComponent]
})
export class AppModule { }
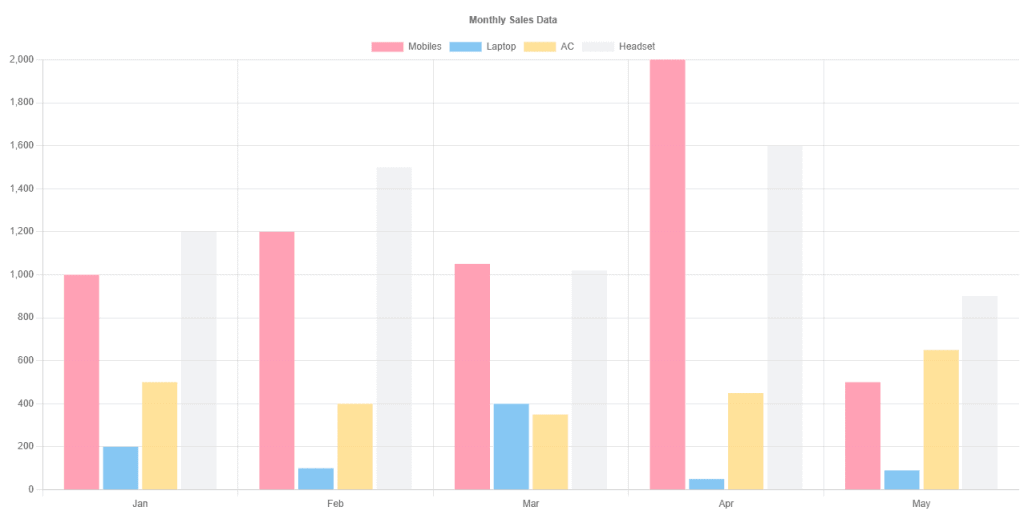
Great, Installation steps are done. Now let’s see how to develop charts using ng2-charts. We will create a bar chart to show monthly sales data.
ng2-charts has one directive for all chart types: baseChart. We will use this directive on canvas to render the chart.
Let’s first prepare the chart data.
Prepare Chart Data
We will create chart data as below, for the demo I am using static data.
  salesData: ChartData<'bar'> = {
    labels: ['Jan', 'Feb', 'Mar', 'Apr', 'May'],
    datasets: [
      { label: 'Mobiles', data: [1000, 1200, 1050, 2000, 500] },
      { label: 'Laptop', data: [200, 100, 400, 50, 90] },
      { label: 'AC', data: [500, 400, 350, 450, 650] },
      { label: 'Headset', data: [1200, 1500, 1020, 1600, 900] },
    ],
  };
labels: It is the x axis labels. It’s necessary for charts:line,barandradar. And just labels (on hover) for charts:polarArea,pieanddoughnut. Label is either a single string, or it may be a string[] representing a multi-line label where each array element is on a new line.datasets: datasets is an array of multiple series. each series represent different dataset. herelabelis shown as the legend and value will be mapped to the respecitve x-axis label.
Chart Options
We can customize charts using various chart options.
chartOptions: ChartOptions = {
    responsive: true,
    plugins: {
      title: {
        display: true,
        text: 'Monthly Sales Data',
      },
    },
  };
There are many other customization options available. Check out more options at Chart.JS Documentation.
Add chart canvas on template
Now to render chart on on-page, we have to add < canvas > on the template. We will use baseChart as below.
Important input properties of baseChart directive :
type: indicates the type of charts, it can be:line, bar, radar, pie, polarArea, doughnutdata: indicates the chart data object.options: indicates the chart options object
Other additional properties:
labels: instead of specifying x-axis labels inChartData, you can create a separate string array and assign it as an input property.datasets: instead of specifying datasets inChartData, we can pass that separate array as an input property.colors: data colors, will use default and|or random colors if not specified.
<canvas baseChart
        [data]="salesData"
        [type]="'bar'"
        [options]="chartOptions"
      >
      </canvas>
It will generate chart as below.
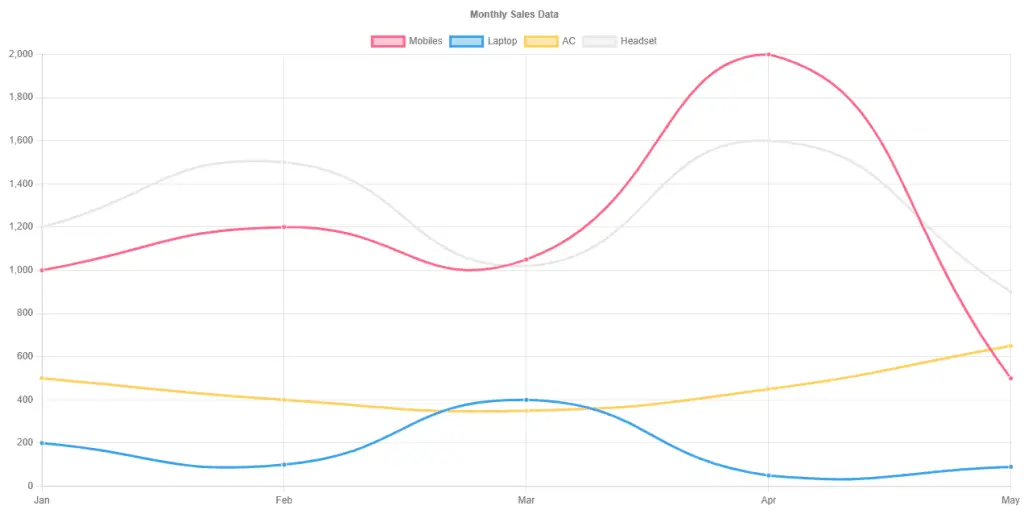
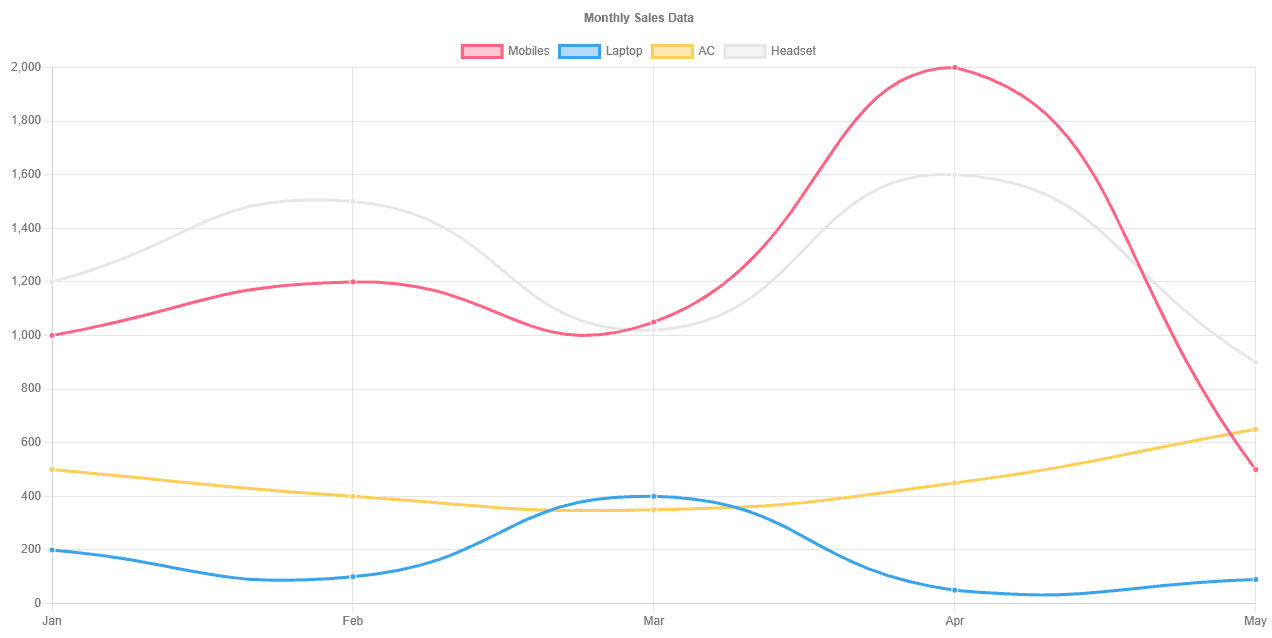
Same as the bar chart we can generate the line chart.
To create a smooth curve line chart we will add one additional property tension: 0.5 in datasets.
  salesData: ChartData<'line'> = {
    labels: ['Jan', 'Feb', 'Mar', 'Apr', 'May'],
    datasets: [
      { label: 'Mobiles', data: [1000, 1200, 1050, 2000, 500], tension: 0.5 },
      { label: 'Laptop', data: [200, 100, 400, 50, 90], tension: 0.5 },
      { label: 'AC', data: [500, 400, 350, 450, 650], tension: 0.5 },
      { label: 'Headset', data: [1200, 1500, 1020, 1600, 900], tension: 0.5 },
    ],
  };
<canvas
   baseChart
   [data]="salesData"
   [type]="'line'"
   [options]="chartOptions"
>
</canvas>
import { Component } from '@angular/core';
import { ChartData, ChartOptions } from 'chart.js';

@Component({
  selector: 'app-root',
  templateUrl: './app.component.html',
  styleUrls: ['./app.component.scss'],
})
export class AppComponent {
  salesData: ChartData<'line'> = {
    labels: ['Jan', 'Feb', 'Mar', 'Apr', 'May'],
    datasets: [
      { label: 'Mobiles', data: [1000, 1200, 1050, 2000, 500], tension: 0.5 },
      { label: 'Laptop', data: [200, 100, 400, 50, 90], tension: 0.5 },
      { label: 'AC', data: [500, 400, 350, 450, 650], tension: 0.5 },
      { label: 'Headset', data: [1200, 1500, 1020, 1600, 900], tension: 0.5 },
    ],
  };

  chartOptions: ChartOptions = {
    responsive: true,
    plugins: {
      title: {
        display: true,
        text: 'Monthly Sales Data',
      },
    },
  };
}
<nav class="navbar navbar-expand navbar-dark bg-dark px-2">
  <a class="navbar-brand" href="#">NG2-CHARTS DEMO</a>
</nav>

<div class="container">
  <div class="card mt-2">
    <div class="card-body">
      <h4 class="card-title">Bar Chart</h4>
      <canvas
        baseChart
        [data]="salesData"
        [type]="'bar'"
        [options]="chartOptions"
      >
      </canvas>
    </div>
  </div>
  <div class="card mt-2">
    <div class="card-body">
      <h4 class="card-title">Line Chart</h4>
      <canvas
        baseChart
        [data]="salesData"
        [type]="'line'"
        [options]="chartOptions"
      >
      </canvas>
    </div>
  </div>
</div>

In this article, We have developed charts in angular 13 with ng2-charts.
We have seen
- Different ways to install ng2-charts in angular app
- Developed the bar chart and line chart using ng2-charts
I hope you like this article, please provide your valuable feedback and suggestions in the below comment section🙂.
For more updates, Follow us 👍 on NgDevelop Facebook page.